Let's visualize Brillouin zone with VESTA
English Follows Japanese
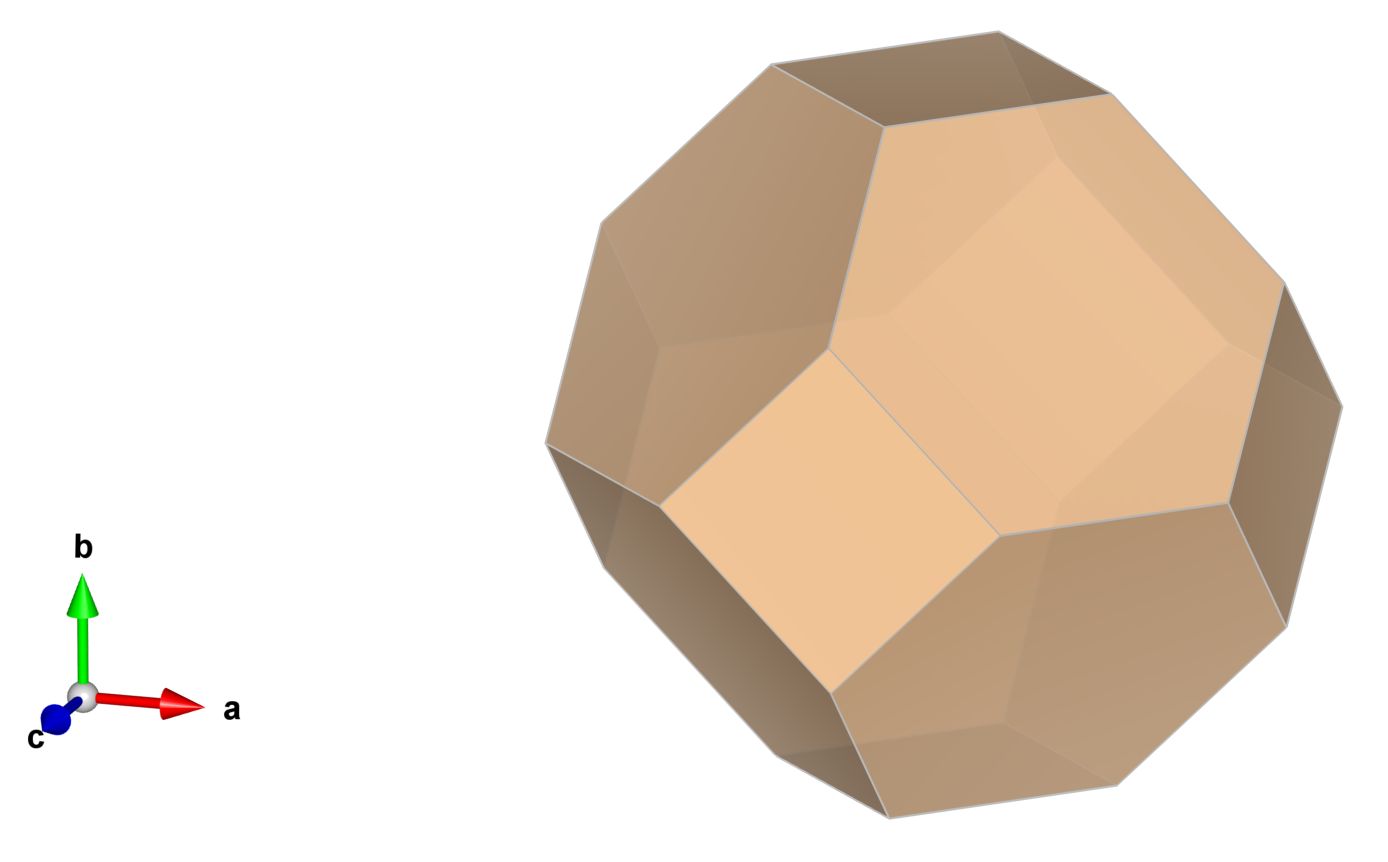
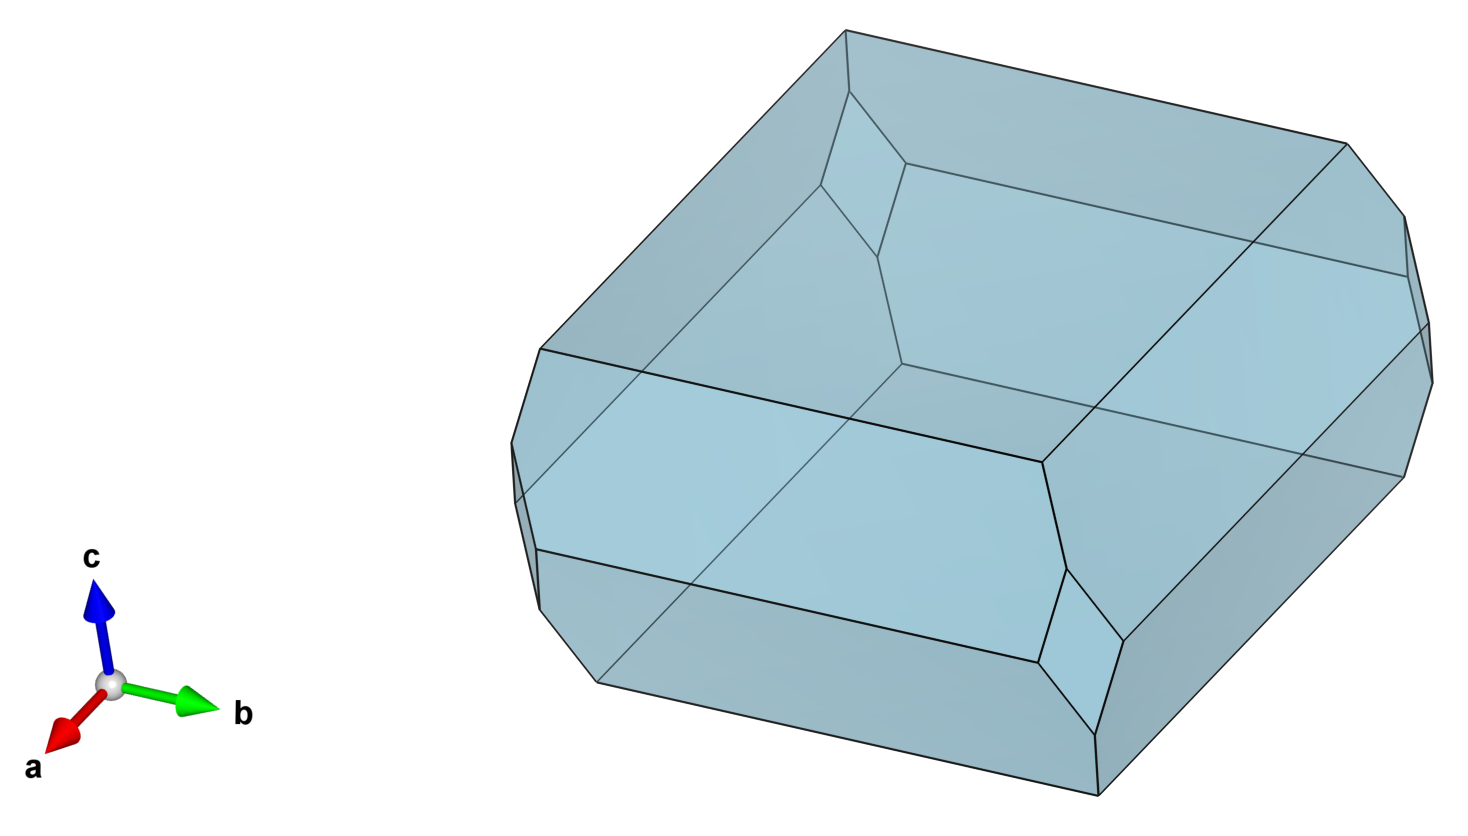
ブリルアンゾーン可視化のためのcifファイルを、実格子のcifまたはPOSCARファイルから生成するPythonスクリプトを作りました。 使い方も含めbzvis.pyをご参照ください。 生成したcifファイルを、VESTAなどの結晶構造可視化ソフトウェアで開いて多面体表示することで、ブリルアンゾーンに対応する凸包が現れます。


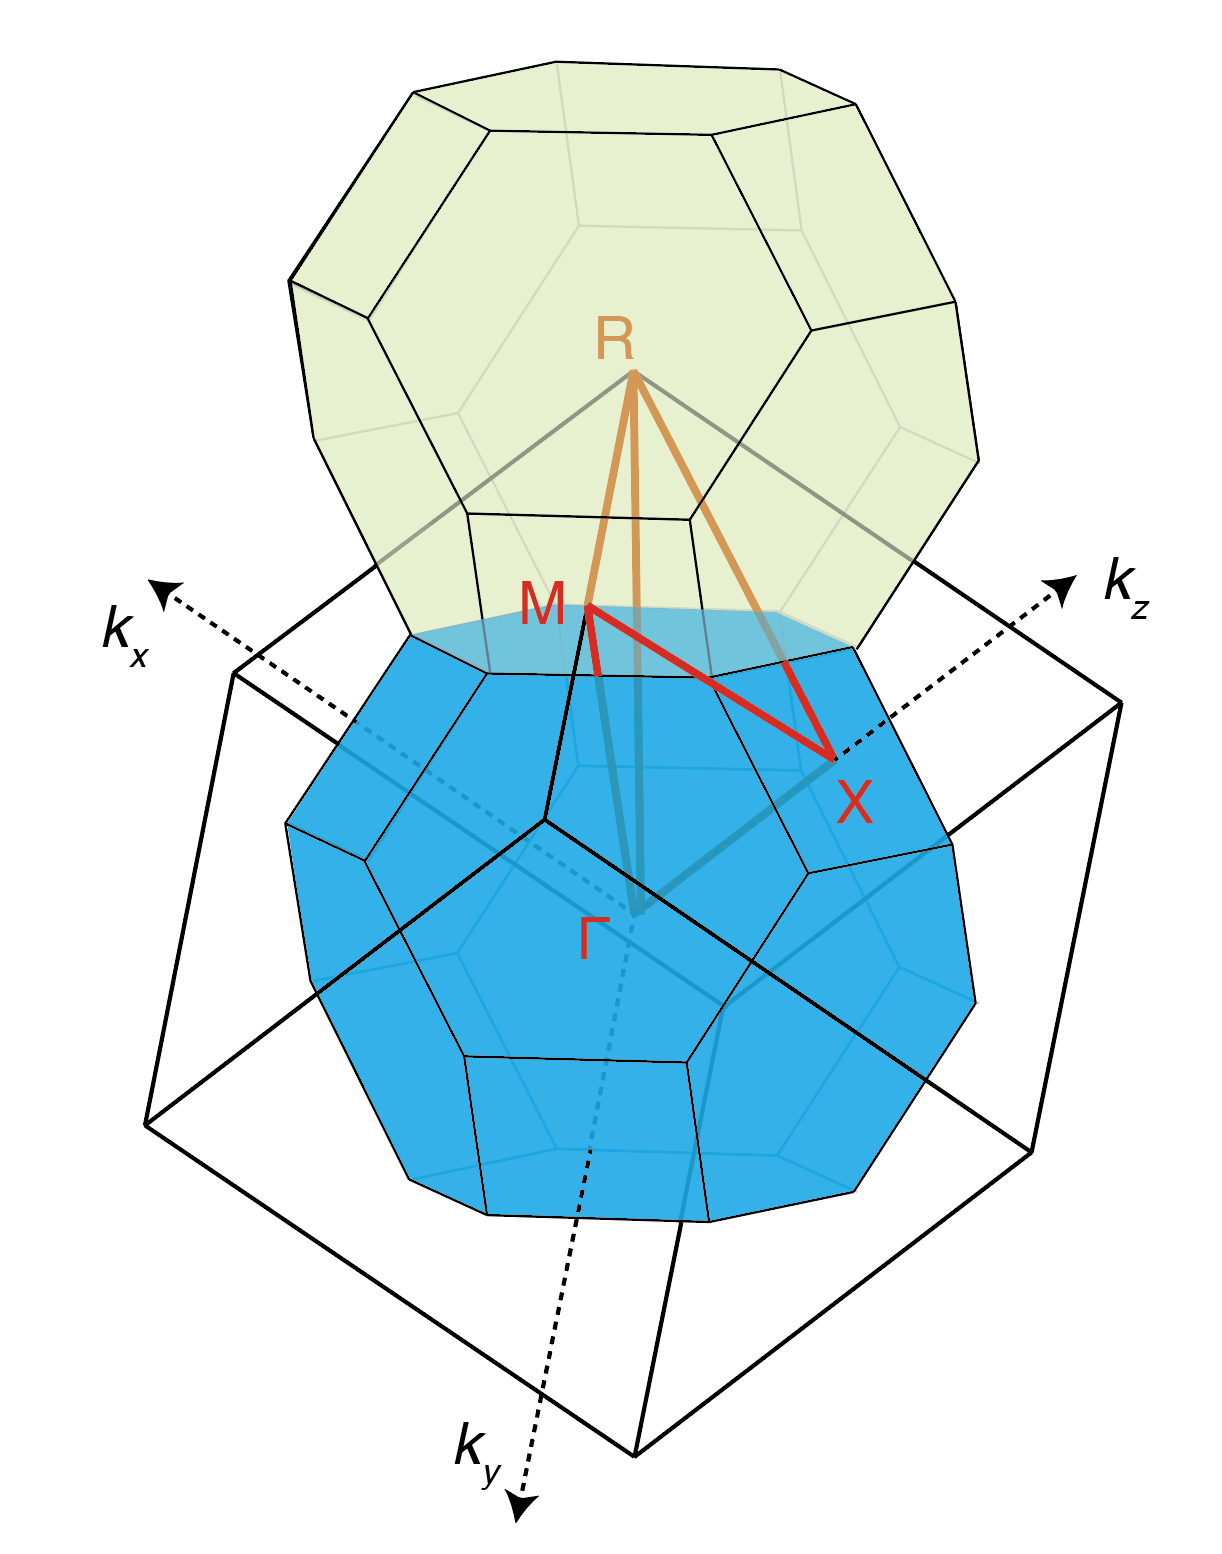
皆さま御存知の通り、ブリルアンゾーンは固体化学・固体物理の教科書に必ず出てきて、非常に魅力的な形をしています。 とはいえ、紙面で目にすることがほとんどで、PC上で描画してクルクル回転させてみたい!と以前から感じていました。 ポスドク時代に作った簡易スクリプトをChatGPTの力を借りてキレイにしたので、この度公開することにしました。 作った当時はこちらを参考にしました (というか、この記事が素晴らしいので、私のスクリプトは些末な応用にすぎません…)。 最近、有償ソフトウェアSingleCrystalで類似の機能が実装されているのですが、本スクリプトを使えば全てフリーソフトで完結するので、まだ価値はあると考えています… 研究はもちろん、授業などでも何かの助けになれば嬉しく思います。 例えば、Pm3m構造のペロブスカイト物質で R点のフォノン凍結が起こると、超格子形成を伴いR3c構造に構造相転移しますが、 このとき逆格子は小さくなり、 Pm3m構造の R点はR3c構造のΓ点に折り畳まれます。 このようなバンドフォールディングの様子も、少し工夫すれば可視化できたりします。色々使えそうじゃないですか?

今の実装がベストだとは思っていません。私の力不足ゆえに不具合・バグなどもちろんあるはずです。 改良点など、お気づきの点があれば吉田までお知らせください。
I wrote a Python script that generates a cif file for visualizing the Brillouin zone using either a POSCAR or cif file as input. Please refer to bzvis.py for download and usage instructions. The generated cif can be opened in crystal visualization software like VESTA and, when displayed in polyhedral style, represents the convex hull corresponding to the Brillouin zone.


As you know, Brillouin zones can be found in all of the solid-state physics and chemistry textbooks, and their shapes are beautiful. But, we usually only see them in static figures. I’ve long wanted to rotate and explore them interactively on my laptop. This script is a cleaned-up version (with the aid of ChatGPT) of one I originally drafted during my postdoc. Actually, a similar function has recently been implemented in the commercial software SingleCrystal; with this script, you can achieve a similar result entirely using free tools. So, I believe it is still useful.
I hope this tool will be useful not only for research but also for teaching. For instance, when a phonon condensation occurs at the R point of a Pm3m perovskite, it leads to a structural phase transition to R3c with a superstructure (enlarged unitcell). At the same time, the reciprocal lattice shrinks, and the original R point folds back to the Γ point in the R3c Brillouin zone. Such band folding can also be visualized. Pretty neat, right?

This is by no means a complete implementation. There are surely bugs and limitations, mostly due to my own shortcomings. If you notice anything that could be improved, I’d really appreciate it if you could let me know.
Enjoy Reading This Article?
Here are some more articles you might like to read next: